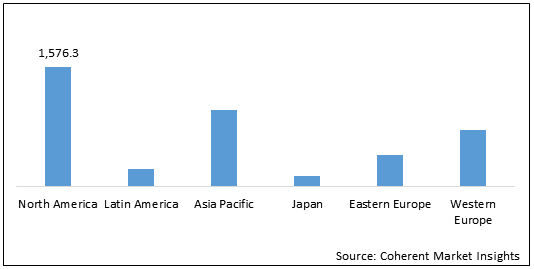
The global mobile application testing solution market is estimated to be valued at US$ 5,222.9 million in 2021 and is expected to exhibit a CAGR of 20.9% over the forecast period (2021-2028).
Figure 1. Global Mobile Application Testing Solution Market Value (US$ Mn), by Region, 2020
Market Trends
Trends by Device
Recent trends indicate that majority of users owning both tablets and smartphones are more likely to be using smartphones at home and outdoors, and limit the usage of tablets to home settings. Smartphones require thorough testing for different networks, which include Wi-Fi and various mobile networks. Tablets are mostly used on Wi-Fi settings at home and testers can focus on testing app performance on Wi-Fi networks. Some tablet manufacturers such as Apple Inc. offer tablet devices that work only with Wi-Fi, thereby reducing the complexity of app testing.
Trends by Type
Applications with new concepts and exciting features gain popularity rapidly. When the number of users on the app increases, the overall performance of the app decreases. As a result, enterprises are introducing load testing in the debugging process. Load testing helps testers understand how the app will respond when the number of users operating the app or a particular function at the same time increases. For instance, Microsoft Corporation’s Visual Studio solution offers cloud-based load testing for the performance of apps.
Figure 2. Global Mobile Application Testing Solution Market Share, By Platform, 2020
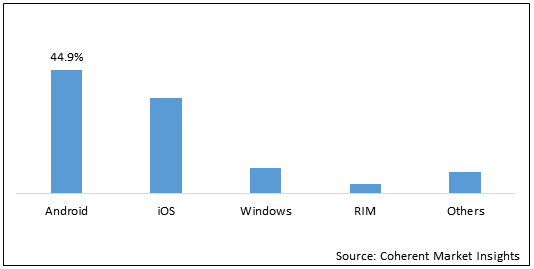
Key Takeaways of the Graph: